
Measuring poverty from satellite images is a version of the oldest problem in communication: recovering a signal from a noisy channel. The thing we want to know — how households actually live — does not appear in a satellite image. What a satellite records is radiance: the brightness of the ground at night, in nanowatts, pixel by pixel. Whether data like night-time lights can measure poverty, and whether more of it measures better, are questions with an exact vocabulary, built by Claude Shannon in 1948 for telephone engineering and used ever since wherever signals have to be pulled out of noise.
Data is not information
The first distinction is the one the vocabulary exists to make. Data is what you collect: pixels, rows, readings. Information is something narrower — the amount by which a piece of data reduces your uncertainty about the thing you care about. Shannon's unit for it, the bit, is a halving: a measurement carries one bit of information about poverty if knowing it cuts the range of your uncertainty in half. The distinction matters because the two can come apart completely. A satellite image of Pakistan contains billions of pixels and, about household consumption, possibly nothing; a survey of one thousand households contains a few hundred thousand numbers and, about household consumption, nearly everything. Volume is a property of data. Information is a relationship between the data and a question.
Data is what you collect. Information is what reduces your uncertainty.
On that definition, night-time lights genuinely inform. Set each district's average radiance against its poverty headcount and the correlation is −0.69: darker districts are poorer districts, and knowing a district's brightness cuts the variance of your best guess about its poverty roughly in half. In Shannon's units that is about half a bit per district — a real, quantifiable contribution, earned by physics: electrification and economic activity produce light, and both track living standards. The question is never whether satellite data carries signal. It is what else it carries, and what happens to the mixture as you ask for more resolution.
Where the noise comes from
Radiance is welfare plus everything else that glows or dims. The everything else has structure, and the structure decides everything downstream. Some noise is instrumental — sensor drift, atmosphere, moonlight corrections — and differs pixel by pixel. Some is economic but not welfare: a gas flare, a highway interchange, a security installation, a port working through the night, none of which feeds a household. Some is model error, introduced when raw radiance is converted into an estimate of wealth by an algorithm trained somewhere else. The amount of noise matters less than two properties: whether it is independent from pixel to pixel, and whether it is stable from year to year.
Both failure modes are visible in Pakistan's satellite record. The brightest patch of rural Sindh is the gas belt of Ghotki district: Daharki, Mirpur Mathelo and Ghotki town glow at four to eight times the rural province's median radiance — the Qadirpur and Mari gas fields, their processing plants and flares, and a fertiliser complex — in a district where two-thirds of people are multidimensionally poor and Daharki's own wealth score sits below the national median. The light is real; almost none of it is household welfare. The mirror image sits at the other end of the country. Aliabad, in Hunza, reads darker than the median rural tehsil of Sindh — sparse settlements strung along mountain valleys, powered by small hydel plants — while the wealth index places it in the 91st percentile nationally. Bright and poor; dark and comparatively well off. A channel that can produce both needs careful decoding.
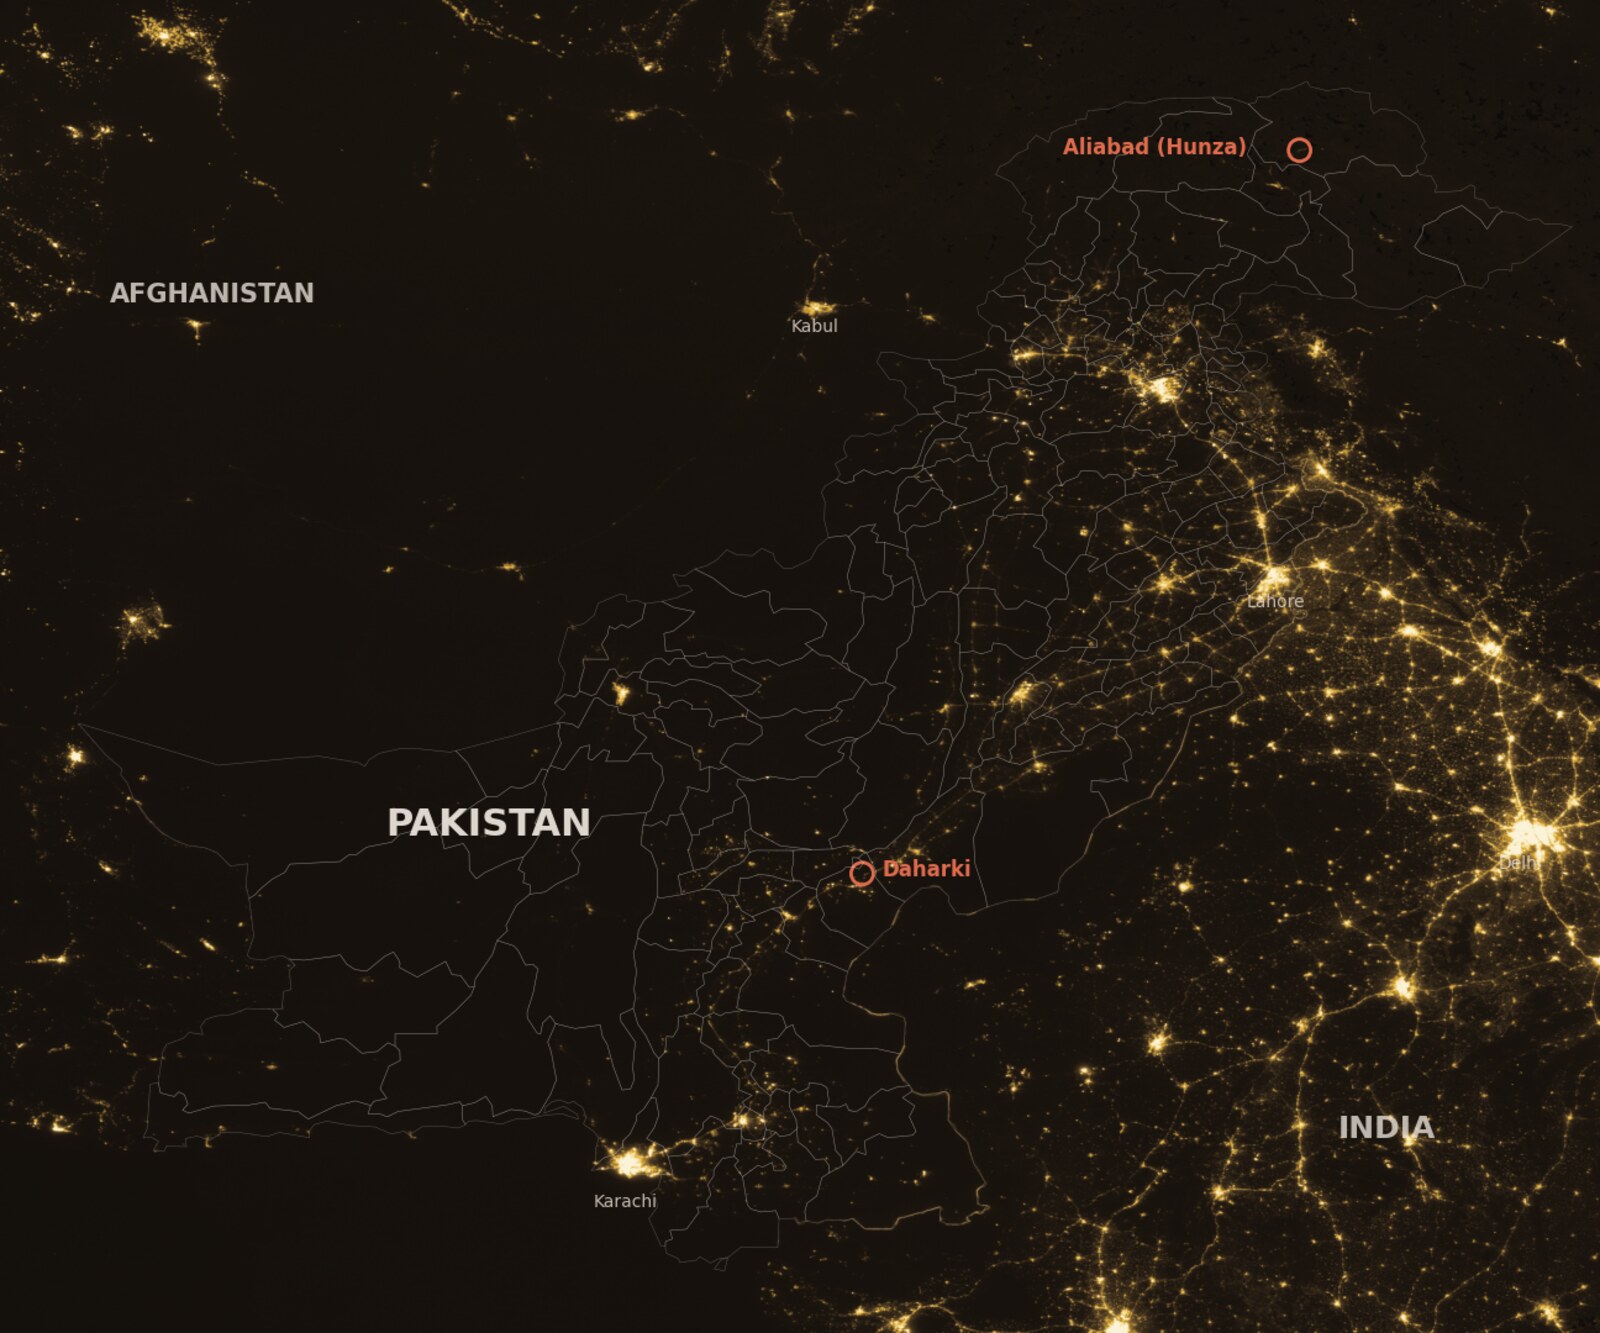
Noise that cancels, and noise that does not
Independent noise has a merciful property: it averages away. Sum many measurements whose errors do not share a cause and the errors offset — the average of N independent errors is smaller by the square root of N. This is why the district layer works. A district's radiance is the average of hundreds of thousands of pixels; the instrumental noise cancels almost entirely, and the half-bit of signal survives. Asking for tehsil resolution spends that advantage twice over. There are fewer pixels to average, and — worse — the largest error sources are correlated within a place: one flare, one highway, one garrison brightens every pixel it touches, and no amount of averaging removes an error that all the pixels share. Correlated noise does not cancel. It compounds into bias, delivered at full apparent precision.
Time behaves the same way. The median tehsil's measured radiance moves about 27 per cent from one year to the next — sensor recalibration, atmosphere, electrification schemes — while no tehsil's living standards move remotely that much. That 27 per cent is a noise floor: a genuine change smaller than the floor is unrecoverable from this channel, however sophisticated the processing. Annual poverty tracking at tehsil level is, in the engineering sense, below the noise floor.
Pakistan's data provides the cautionary specimen. In Rajanpur, the wealth index assigns the district's highest score to the De-Excluded Area, the sparsely settled former tribal strip that is, by any ground measure, its poorest corner. Where population is thin, the model has few welfare-bearing pixels to read and extrapolates from whatever features remain. The fix is routine: normalise by population, so that a stray bright pixel over a handful of households is not read as wealth. But the fix has to be applied by an analyst who understands the context, and it works because the analyst brings information the model does not have. The index itself arrives with no warning attached. That is the signature of proxy error. It does not announce itself with a standard error, the way sampling error does.
Two proxies are not two witnesses
A tempting check is to compare one satellite measure against another: tehsil radiance and Meta's Relative Wealth Index correlate at 0.83, still 0.69 after stripping out district averages. But information theory has a rule about this — the data-processing inequality, which says that no amount of processing can add information about a target that was not in the inputs. The wealth index is built partly from night-time lights. Where the two agree, they are in part quoting the same source, and agreement with yourself is not corroboration. Two derived measures sharing an input are, for verification purposes, closer to one witness than two.
The codebook
Shannon's receiver needs one more thing to recover a message: the code that maps signal to meaning. Radiance means poverty only through a calibration — a mapping estimated in the places and years where satellites and surveys observed the same ground. The surveys are the codebook, and codes drift. Rural electrification, solar home systems, grid failures: each rewrites the relationship between light and living standards, and only fresh ground truth can re-estimate it. This is the structural reason proxies cannot replace surveys, however fine their resolution becomes: every bit of information the proxy carries was borrowed, at calibration time, from a questionnaire.
So is more data better?
The framework gives a precise answer. More data is more information only when it adds an independent reading of the thing you care about. Past that point it is only more data. Sampling error is honest: it is printed beside the estimate and shrinks as the sample grows. Proxy error is silent: it carries no number, and it does not shrink as granularity increases. So aggregate until the noise cancels, and keep running surveys, because every proxy is calibrated against them. Granular data ranks; aggregate data measures. More data is better exactly as far as the signal in it can be separated from the noise.
Correlations: district radiance v poverty headcount, r = −0.69 across the 119 districts with both values (headcounts constructed by Data Darbar from PSLM microdata by the Alkire-Foster method; radiance is the 2024 VIIRS annual composite, population-weighted across tehsils and taken as log(1+x) — Figure 1 plots exactly this, and its file ships as lights_districts.csv). The "half a bit" figure is the Gaussian mutual information −½log₂(1−r²) ≈ 0.46 bits. Tehsil radiance v Meta Relative Wealth Index: r = 0.83 across 552 tehsils, 0.69 within districts (503 tehsils in districts with three or more); the RWI's published feature set includes night-time lights, hence the circularity caveat. The 27 per cent noise floor is the median absolute year-on-year log change in tehsil radiance across 459 tehsils with five or more annual observations, 2020–2026. The national 28.9 per cent is consumption poverty from HIES 2024–25 — the only official statistic in the piece — and is not comparable to the multidimensional headcounts. Shannon's framework is "A Mathematical Theory of Communication" (1948); the data-processing inequality is standard in any information-theory text. All three data layers ship with this issue as lights_tehsils.csv and mpi_districts.csv.