
Export-led growth is Pakistan's permanent ambition. The budget passed in June is its latest statement, invoking competitiveness in every chapter. The ambition is the correct one, and the logic is simple. A country that sells to the world earns dollars. Its firms have to compete with the most competitive firms anywhere, so they are forced to get better at making things. Firms that are better at making things create the room to pay their workers more. Every economy that has escaped poverty in the past seventy years took this road. Yet in Pakistan, the plans keep failing, and for the same reason each time: they set the destination without building the engine — the productivity growth that would carry the economy there.
The record shows what happens instead. Twice in the past six years, growth reached the range that finance ministers have promised — 5.8 per cent in FY21 and 6.2 in FY22, some of it post-Covid catch-up. But it did not settle there; within a year it was minus 0.2. The trigger for the fall was external — the oil and commodity surge of 2022. The route the damage took was domestic and familiar: an economy that accelerates through consumption will pull in imports faster than it earns the dollars to pay for them.
The 2018 boom, which peaked at 6.1 per cent, needed no shock at all. It was built on a rupee held artificially strong — nearly a quarter above its 2010 level on the State Bank's own trade-weighted index, defended with some $7 billion of reserves. A strong rupee made imports cheap and exports uncompetitive, so the boom it produced could only run for as long as the reserves did. One boom was ended by the oil price; the other by the cost of defending the rupee. The anatomy was identical: in both cases, growth was financed with dollars the economy had not earned. The saw-tooth pattern this produces is not bad luck arriving at regular intervals. It is the same mechanism, repeating.
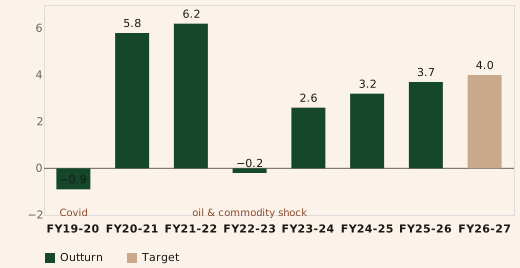
Pakistan's booms do not wind down. They run out of dollars.
No growth rate fully survives a shock. Whether it is dented or completely undone is decided by its composition. An economy that grows by raising output per worker earns its expansion — more value from the same barrel of oil, the same machines, the same people, and an import bill that grows more slowly than GDP. That economy is resilient: an oil spike dents it without undoing it. An economy that grows by adding workers and consumption borrows its expansion against the next shock, and is fragile by construction, however fast it moves in the short run. An export-led economy belongs to the first kind, because every sale it makes is tested against world prices. Successive budgets have legislated for it. Pakistan, so far, belongs to the second.
Let's start with where people work. The Labour Force Survey published in February records the kind of movement needed for the plans to work — workers leaving agriculture — but not the destination, which is the factory. On the comparable definition, agriculture's share of employment fell from 37.4 to 35.1 per cent between 2020–21 and 2024–25. Manufacturing's share fell too, from 14.9 to 14.4. Instead, the increases were in wholesale and retail, transport, and personal services — sectors where informal work is the rule. This is a services transition, but not the kind that shows up in productivity statistics: it is the movement of labour from one low-productivity, uncounted corner of the economy to another.
The survey's headline informality figure counts everyone working without a registered employer, a written contract or social security — 80.8 per cent of all employment, on the new 19th ICLS definition. That number puts a limit on how much of the workforce any budget's instruments can actually reach. Corporate tax rates, customs schedules, and export rebates operate only on the fifth of the workforce in formal employment; the other four-fifths they barely touch.
The survey's wage numbers show who carried the last stabilisation — the four years of high interest rates, import controls and fiscal tightening that followed the 2022 crisis. Average nominal wages rose 62 per cent between the two survey rounds, from Rs24,028 to Rs39,042 a month, while consumer prices rose roughly 87 per cent — a real wage cut of about 13 per cent. That is what adjustment looks like in an informal economy: prices move, wages may never catch up, and the household absorbs the shock the state cannot. One sign of that adjustment is a three-point rise in female labour force participation in four years, as households sent more members out to work — a rise examined closely in piece 02 of this issue. And where that rise is happening settles what it means for growth: it is concentrated in poor, rural, low-education districts, in exactly the kind of work that adds workers without adding output per worker. Participation of this kind enlarges the labour force. It does not build the engine.
Underneath all of it is the variable this journal will keep returning to, the simplest measure of productivity there is — output per worker, which can be calculated by dividing what the economy produces by the number of people producing it. Looking at the trend from FY21 to FY25, real GDP grew about 12 per cent, while employment grew by 14.8 per cent, from 67.25 to 77.2 million. Taken together, this shows that output per worker fell by roughly 2.5 per cent on the surveys' own counts. Even that flatters the record: the new survey round counts employment more narrowly than the old one, so on a like-for-like definition the workforce grew faster and productivity fell further. More people are working, but they are collectively less productive. Economic growth can come from two sources: more people working, or more output from each person working. What we see from the above trends is that the entirety of Pakistan's expansion belongs to the first of these: for every one per cent that output grew, employment grew by more than one per cent.
Why the engine is not turning
Growth of this composition generates no slack to absorb a shock — no rising export earnings per worker, no falling import intensity. It was why the 2022 shock cost so much. The FY22 boom was built exactly this way, so when oil prices spiked there was no buffer to draw down, and the adjustment came out of the growth itself — all 6.2 per cent of it, and more, within a year.
So why isn't output per worker rising? Let's start with what would need to happen for it to rise. A worker produces more when they have more to work with — machines, equipment, electricity, a workplace — or when they move to a job where those things are more concentrated. Pakistan is currently managing neither. Take the first route. The country invested 14.4 per cent of GDP in FY26, roughly where the rate has sat for years, and that investment has claims on it before it makes anyone more productive: replacing machinery as it wears out and equipping the roughly 2.5 million people who join the workforce each year. Whether that is enough to keep pace with a workforce growing at 3.5 per cent a year is genuinely uncertain. It depends on how fast existing machinery wears out and how much capital each new job needs, and neither is measured well in Pakistan. What can be said is that the margin, if there is one, is thin — and the Labour Force Survey suggests what thin capital looks like on the ground. Four workers in five are in informal jobs — stalls, carts, courtyard workshops, other people's fields — work that typically employs little capital beyond the worker's own hands.
The second route is moving workers to where capital is already concentrated. Economists call this reallocation, and it works like an escalator: moving from the farm to the factory, or from a small workshop to a larger firm, puts the same worker in a job where their hours produce more. That escalator carried every East Asian transformation. In Pakistan, it stalls at the second step: a worker leaving the farm gains from the move, but manufacturing — the sector that should carry them upward — employs 14.8 per cent of Pakistan's workforce while producing just 12.1 per cent of its GDP. Output per worker runs about a fifth below the economy's average because most of the sector is small-scale and informal.
What the budget can and cannot reach
Firms that stay informal stay small, out of the credit market and out of reach of every instrument in the finance bill. Nothing in the budget reaches those firms directly, because a firm stays informal because, from where its owner sits, informality adds up. Registering would bring tax and compliance costs. A bank would probably not lend to the firm either way. And enforcement will probably never arrive. These are tax, banking, and enforcement problems, and no tariff policy can solve them. What the budget's tariff relief can change is a different obstacle: the incentive that has kept manufacturing pointed inward. Decades of protection made selling to the captive home market more profitable than exporting, and placed greater taxes on the imports any would-be exporter might need. The June budget lowered those tariff walls, cutting additional customs duty on 3,149 tariff lines and capping regulatory duty on nearly 2,000 more, so that industry buys its inputs at closer to world prices. It trimmed exporters' taxes as well. That shifts the calculus: cheaper inputs raise value added per worker inside the formal tradable sector, and a smaller premium on protection raises the return to joining it. Of everything announced in June, this is the one measure that works on the engine itself — the efficiency of each firm and worker — rather than on how hard the accelerator is pressed. But it works on the margin between firms, and the four-fifths of employment outside the formal economy will feel it slowly, if at all.
The export side of the ledger is where the reform will first be tested, and FY26 was not kind to it. Goods exports fell by 5.4 per cent to $25.8 billion in the Economic Survey's reporting window, while imports rose 8.5 per cent to $52.8 billion. By March, the trade deficit had reached $23.5 billion. Textiles — more than half of everything Pakistan sells abroad — finished the full year at $17.9 billion, almost exactly where they started. Inside that flat total, however, the composition is quietly improving. The same cotton earns very different amounts depending on how much work is done to it before it leaves the country: spun into yarn it earns the least, woven into cloth somewhat more, cut and stitched into a finished garment the most, because each stage adds Pakistani labour and skill to the price. It is the last of these — readymade garments — that set a record in FY26: $4.18 billion, up 5.5 per cent while the rest of the sector stood still. That is the engine working, even if it is at a relatively small scale: more value has been earned from the same input. But a growing sliver inside a flat total still leaves the total flat. And that raises a question. The current acceleration is pulling in imports, as accelerations here always do, and imports must be paid for in dollars. If exports are not earning the additional dollars, something else is.
The something else is remittances. Roughly $38 billion is sent home by Pakistanis abroad in eleven months of the year, up 9 per cent — about one and a half times what the country earned from goods exports, and the flow that kept the current account near balance. Remittances are the economy's real shock absorber, and they are a good one: countercyclical, dollar-denominated, and paid straight into household budgets. That is also what connects them to the household survey. Money sent home arrives as income to be spent, not as investment — it finances consumption and cushions wage losses, and it leaves no factory behind. HIES 2024–25, the expenditure survey conducted across 32,814 households, records where four years of adjustment left the country even with that cushion: a poverty headcount of 28.9 per cent. The crossover — remittances passing goods exports during Covid and never looking back — is traced in this issue's Plotline, Adaad's one-chart piece: a single chart, one clear story, in every issue. A buffer of this size is a blessing in a shock. It is also nobody's growth strategy: it substitutes for the engine rather than building it.
So the metric to focus on is not the growth rate; it is the resilience underneath it. That will show up in the microdata long before the national accounts: manufacturing's employment share rising rather than slipping, formal jobs growing faster than informal ones, output per worker turning positive, an import bill growing more slowly than GDP. Reading and interpreting these data sources are what this journal is about. Until those indicators turn, the next boom will end the way the last two did.
National aggregates are from the official releases cited in this issue's sources: PBS national accounts and the Economic Survey for growth and trade; LFS 2024–25 for employment and wages; HIES 2024–25 for households. The growth series FY20–FY22 is computed from the Economic Survey's constant-price levels (Table 1.1, 2015-16 base); FY23–FY26 are as revised in the FY26 accounts; FY27 is the budget target. Employment-share comparisons use the survey's comparable 13th ICLS series; the 80.8 per cent informality figure is on the 19th ICLS basis — the definitional break is discussed in piece 02, Counting women in. Output per worker compares cumulative real GDP growth FY21–FY25 with employment growth between the two LFS benchmarks (67.25m to 77.2m); the 2020–21 count is 13th ICLS and the 2024–25 count 19th ICLS, which is narrower, so the stated productivity decline is a lower bound. Sector relative productivity divides FY26 GDP shares by LFS 2024–25 employment shares. The real wage change deflates the LFS wage growth by CPI compounded across FY22–FY25.