
In the quarter of districts with the smallest girls’ share of government schools from middle grade upwards, by official designation, the average district enrolment rate for girls aged 5–16 is 35.1 per cent. This finding combines enrolment from Pakistan’s 2023 Census with school-location data for 123 districts. In the quarter with the largest girls’ share, the average is 71 per cent, narrowing the average gap to boys’ enrolment from 12.9 percentage points to 2.1.
Government schools are designated for boys, girls or mixed enrolment, which allows the two gendered networks to be mapped separately. Across Sindh, however, many government schools are mixed in practice, so the official designation understates the number of schools serving girls. The opening comparison is sensitive to how Sindh’s schools are counted.
The difference extends beyond school numbers to how far the two networks reach. In 101 of the 132 mapped districts, the nearest girls’ school teaching middle grades or above is farther away than the boys’ equivalent. At village level, the shortage is harder to miss: 33,859 of the 45,351 populated rural mouzas covered by the data have no girls’ middle school of any kind.
Building the school map
Pakistan has no single public map of its government schools. Each province maintains its own public repository, but the level of detail varies sharply.
Balochistan publishes school coordinates directly. Sindh and Khyber Pakhtunkhwa provide locations through their education departments’ school records, while Punjab and Gilgit-Baltistan publish lists lacking coordinates, requiring school locations to be reconstructed from their recorded settlement names.
Together, these sources locate 118,677 government schools across 132 districts, covering 94.5 per cent of the schools listed by the provincial records. Private and non-formal schools are excluded on account of uneven public coverage across provinces: Punjab documents much of its private sector, while other provinces publish little or none. Including them would risk comparing differences in record-keeping, as opposed to differences in access.
The 2023 Census has wider reach than the school-location data. It records enrolment among children aged 5–16 in every district, including the seven ex-FATA merged districts, where school locations are not published. The Census captures their enrolment, but the absence of school locations leaves them out of the distance analysis.
That matters because some of the country’s widest gender gaps are there: 34.4 percentage points in Orakzai, 32.6 in Mohmand and 30.2 in Bajaur. Without their school-location data, we cannot tell whether including them would strengthen or weaken the relationship between distance and enrolment.
Measuring the journey
For every populated one-kilometre grid cell, the analysis calculates the distance to the nearest girls’ and boys’ government school teaching middle grades or above. District figures are weighted by population, so a sparsely populated area does not count as much as a populated settlement.
The interactive map also estimates walking time, using a model that accounts for the difficulty of travelling through different terrain. Straight-line distance carries the national comparison, while walking time is also shown on the map and in Figure 7.
The focus on middle grades and above also matters. Gender labels can be especially loose at primary level: in Sindh, schools designated for boys commonly enrol girls. The split between the two government networks becomes more meaningful higher up the school system, but Sindh remains an exception throughout. Girls are enrolled in 6,269 of the province’s 6,998 government schools teaching middle grades or above, although only 1,609 are designated for girls. When Sindh schools are counted according to whether girls are enrolled, instead of how they are designated, the difference in distance to girls’ and boys’ schools falls close to zero in every district.
Same district, different access
Across the 132 districts with mapped school locations, girls’ middle-or-higher schools are farther away than boys’ schools in 101. Girls’ schools are closer in 30 districts, while Lodhran records an exact tie. The median district-level gap is 0.6 kilometres, with girls’ schools farther away.
But the median across mapped districts conceals much wider differences. Several of the widest district gaps are in Balochistan. In Zhob, the nearest girls’ school is 16.3 kilometres farther away than the nearest boys’ school; the gap is 12.2 kilometres in Washuk and 10.4 in Kohlu.
At provincial level, larger distance gaps go hand in hand with smaller girls’ networks (Figure 2). In Balochistan, the population-weighted median distance to a girls’ school is 5.7 kilometres, against 3.7 for boys. In Punjab, girls’ schools are marginally closer: 2.1 kilometres, against 2.3 for boys.
Remoteness does not explain the full difference. Boys and girls within the same district share much of the same terrain and settlement pattern. Comparing the two networks narrows the question from remoteness in general to how government provision differs between them.
Distance is one way to see the gap. The village-level Mouza Census gives a more immediate measure: whether a school of any kind exists within a village at all.
Of the 45,351 populated rural mouzas covered by the Mouza Census, 33,859 have no girls’ middle school. In Balochistan, 90.1 per cent have none; in Sindh, 80.9 per cent; and in Khyber Pakhtunkhwa, 76.1 per cent.
The disparity appears even before middle school in Sindh. About four in ten populated rural mouzas have no girls’ primary school, compared with roughly one in ten without a boys’ primary school. By middle grades, the share of mouzas without a girls’ school rises to four in five.
The two measures answer different questions. A village without a girls’ school may have one nearby, across its boundary. The distance measure captures that wider reach; the Mouza Census shows when the school is absent from the village itself.
Why the road to school ends sooner for girls
The distance gap on the map reappears in household accounts of why rural children leave school. Cost barriers are reported at nearly even rates for girls and boys: “too expensive” is cited for 16 per cent of girls who left school and 15 per cent of boys. Distance, parental permission and the absence of female staff are far more heavily concentrated among girls. “Too far away” is cited for 12.6 per cent of girls, more than twice the 4.9 per cent for boys. “Parents did not allow” rises to 13.7 per cent for girls and barely registers for boys, at 0.1 per cent; “no female staff” is cited for 6.5 per cent and 0.2 per cent respectively.
These figures cover rural children who had been enrolled and later left school, and are not available district by district. Among children still attending, girls and boys report similar travel distances. That apparent parity may partly reflect who remains enrolled: some girls have already left school because the journey was too far. The journey looks more equal among the children who are still making it.
Where access shows up in enrolment
Across districts, the median enrolment rate is 48.8 per cent for girls and 60.6 per cent for boys. The median gender gap is 9.4 percentage points. The widest gaps sit where girls’ enrolment is already low. In Hangu, just 38 per cent of girls aged 5 to 16 are enrolled, compared with about 71 per cent of boys. A five-point gap can accompany various overall enrolment rates, from near-universal enrolment to a district where fewer than half of girls are in school. Figure 5 therefore keeps the underlying overall enrolment rate alongside the gaps.
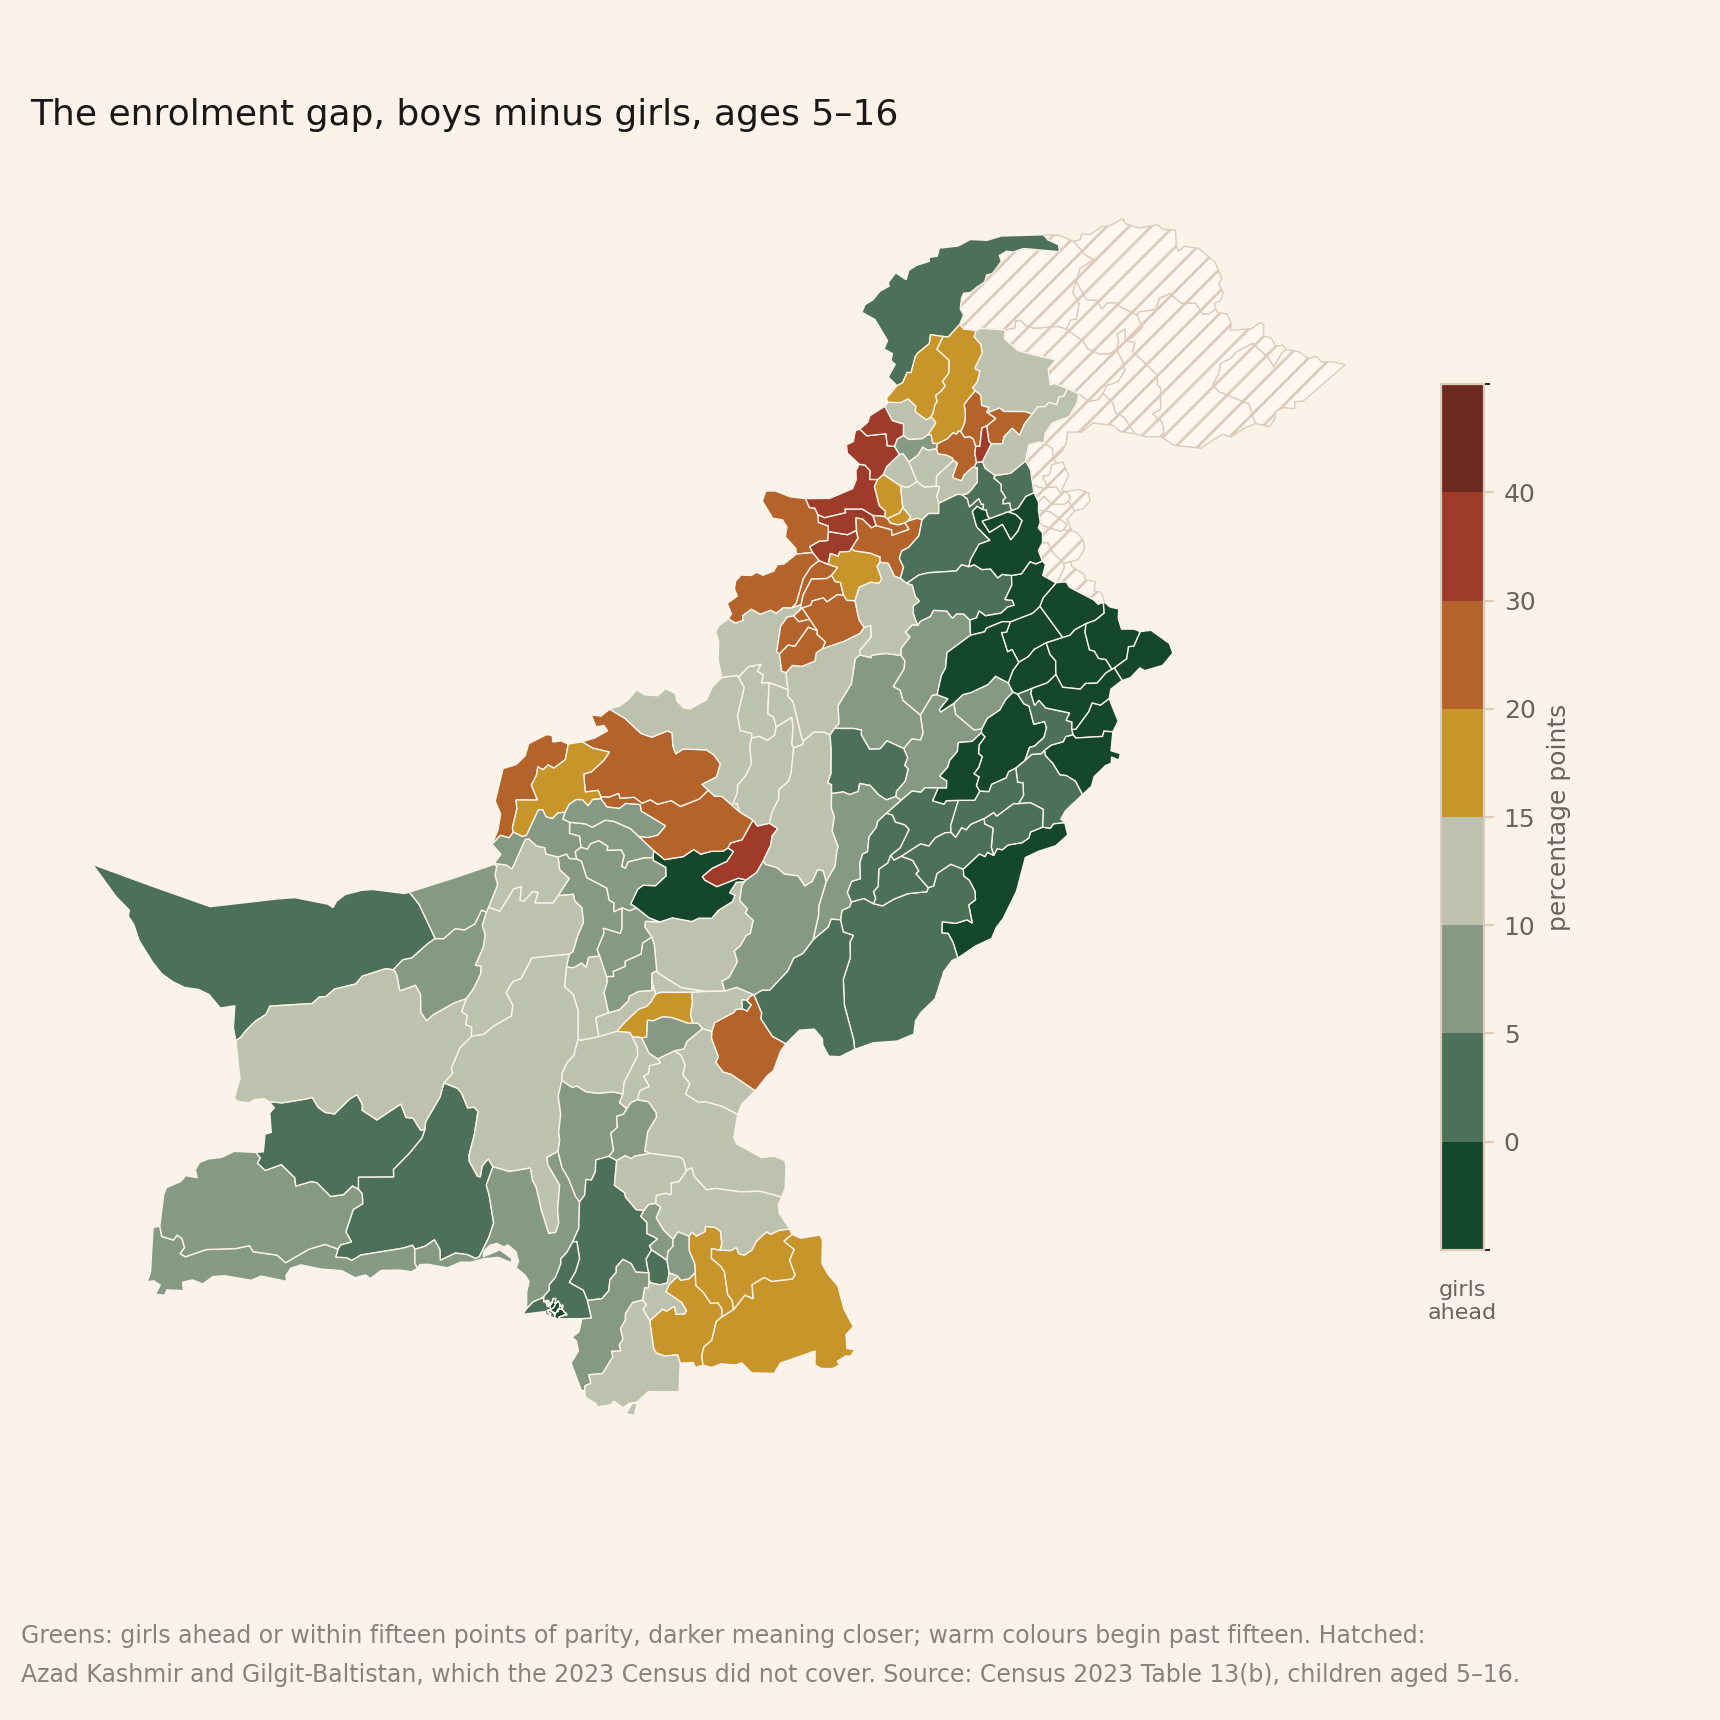
Enrolment rates by district, ages 5–16
| District | Girls enrolled (%) | Boys enrolled (%) | All children enrolled (%) | Gap (pp) |
|---|---|---|---|---|
| Abbottabad | 86.6 | 87.8 | 87.2 | 1.2 |
| Attock | 80.8 | 82.2 | 81.5 | 1.4 |
| Awaran | 46.8 | 49.4 | 48.1 | 2.6 |
| Badin | 29.6 | 46.5 | 38.6 | 16.9 |
| Bahawalnagar | 66.1 | 65.1 | 65.6 | -1.0 |
| Bahawalpur | 59.2 | 59.4 | 59.3 | 0.3 |
| Bajaur | 20.5 | 50.6 | 35.7 | 30.2 |
| Bannu | 39.2 | 61.5 | 51.2 | 22.3 |
| Barkhan | 24.4 | 56.8 | 41.7 | 32.3 |
| Batagram | 41.2 | 64.3 | 53.2 | 23.1 |
| Bhakkar | 67.8 | 74.0 | 71.0 | 6.3 |
| Buner | 50.3 | 74.7 | 63.1 | 24.4 |
| Chaghi | 27.8 | 32.3 | 30.1 | 4.5 |
| Chakwal | 83.9 | 85.6 | 84.8 | 1.8 |
| Charsadda | 64.7 | 75.6 | 70.4 | 10.9 |
| Chiniot | 67.5 | 73.8 | 70.7 | 6.3 |
| Chitral | 80.8 | 85.0 | 82.9 | 4.2 |
| Dadu | 47.9 | 56.9 | 52.5 | 9.0 |
| Dera Bugti | 20.1 | 33.5 | 28.2 | 13.5 |
| Dera Ghazi Khan | 47.5 | 57.7 | 52.7 | 10.2 |
| Dera Ismail Khan | 47.2 | 60.7 | 54.3 | 13.5 |
| Faisalabad | 79.6 | 79.5 | 79.5 | -0.1 |
| Ghotki | 31.8 | 55.5 | 44.3 | 23.7 |
| Gujranwala | 81.4 | 76.3 | 78.8 | -5.0 |
| Gujrat | 87.2 | 82.3 | 84.8 | -4.9 |
| Gwadar | 61.3 | 69.7 | 65.8 | 8.3 |
| Hafizabad | 79.2 | 76.2 | 77.7 | -3.0 |
| Hangu | 38.5 | 71.5 | 55.9 | 33.0 |
| Haripur | 84.0 | 87.4 | 85.7 | 3.4 |
| Harnai | 24.7 | 34.1 | 29.6 | 9.4 |
| Hyderabad | 65.7 | 66.7 | 66.2 | 1.0 |
| Islamabad | 84.7 | 83.1 | 83.9 | -1.6 |
| Jacobabad | 30.1 | 45.3 | 37.9 | 15.2 |
| Jaffarabad | 30.0 | 40.9 | 35.6 | 10.9 |
| Jamshoro | 49.2 | 52.0 | 50.7 | 2.9 |
| Jhal Magsi | 26.2 | 40.7 | 33.6 | 14.5 |
| Jhang | 69.6 | 74.8 | 72.3 | 5.2 |
| Jhelum | 86.7 | 86.4 | 86.6 | -0.3 |
| Kachhi | 19.3 | 26.7 | 23.3 | 7.4 |
| Kalat | 29.1 | 42.2 | 35.9 | 13.1 |
| Kambar-Shahdadkot | 38.6 | 49.6 | 44.5 | 11.0 |
| Karachi Central | 77.4 | 72.5 | 74.8 | -4.9 |
| Karachi East | 74.0 | 67.7 | 70.6 | -6.3 |
| Karachi South | 71.0 | 72.9 | 72.0 | 1.9 |
| Karachi West | 57.5 | 59.5 | 58.5 | 2.0 |
| Karak | 63.8 | 79.3 | 71.9 | 15.5 |
| Kashmore | 23.8 | 35.8 | 30.0 | 12.1 |
| Kasur | 76.1 | 74.6 | 75.4 | -1.5 |
| Keamari | 54.3 | 58.3 | 56.4 | 4.0 |
| Kech | 51.6 | 59.7 | 55.8 | 8.2 |
| Khairpur | 48.3 | 62.5 | 55.5 | 14.2 |
| Khanewal | 69.9 | 73.1 | 71.5 | 3.2 |
| Kharan | 31.8 | 40.6 | 36.7 | 8.8 |
| Khushab | 74.8 | 79.8 | 77.4 | 5.0 |
| Khuzdar | 26.6 | 37.3 | 32.6 | 10.7 |
| Khyber | 29.3 | 63.2 | 47.3 | 33.9 |
| Killa Abdullah | 17.1 | 37.2 | 28.3 | 20.0 |
| Killa Saifullah | 22.2 | 49.7 | 37.0 | 27.5 |
| Kohat | 55.8 | 80.3 | 68.7 | 24.5 |
| Kohistan | 12.1 | 26.1 | 19.4 | 14.0 |
| Kohlu | 28.7 | 28.2 | 28.4 | -0.5 |
| Korangi | 67.0 | 66.1 | 66.5 | -0.9 |
| Kurram | 33.7 | 54.4 | 44.8 | 20.7 |
| Lahore | 79.0 | 76.3 | 77.6 | -2.7 |
| Lakki Marwat | 43.7 | 68.8 | 56.4 | 25.1 |
| Larkana | 49.2 | 60.6 | 55.3 | 11.4 |
| Lasbela | 36.3 | 44.9 | 40.7 | 8.6 |
| Layyah | 73.9 | 78.6 | 76.3 | 4.7 |
| Lodhran | 60.6 | 62.7 | 61.7 | 2.1 |
| Loralai | 25.8 | 51.2 | 39.2 | 25.4 |
| Lower Dir | 65.6 | 78.9 | 72.5 | 13.3 |
| Malakand | 75.5 | 81.3 | 78.5 | 5.7 |
| Malir | 56.3 | 57.8 | 57.1 | 1.5 |
| Mandi Bahauddin | 77.8 | 76.0 | 76.9 | -1.8 |
| Mansehra | 72.7 | 84.2 | 78.6 | 11.6 |
| Mardan | 66.1 | 77.6 | 72.1 | 11.4 |
| Mastung | 37.4 | 50.9 | 44.8 | 13.5 |
| Matiari | 44.8 | 54.6 | 49.8 | 9.8 |
| Mianwali | 67.1 | 78.9 | 73.2 | 11.8 |
| Mirpurkhas | 39.6 | 56.8 | 48.8 | 17.1 |
| Mohmand | 19.7 | 52.2 | 36.1 | 32.6 |
| Multan | 66.2 | 69.6 | 67.9 | 3.4 |
| Musakhail | 42.1 | 53.2 | 48.2 | 11.1 |
| Muzaffargarh | 51.8 | 58.6 | 55.3 | 6.7 |
| Nankana Sahib | 75.4 | 76.2 | 75.8 | 0.7 |
| Narowal | 86.3 | 84.0 | 85.1 | -2.3 |
| Nasirabad | 21.6 | 31.4 | 26.7 | 9.8 |
| Naushehro Feroze | 57.2 | 63.9 | 60.6 | 6.7 |
| North Waziristan | 18.5 | 45.6 | 32.5 | 27.0 |
| Nowshera | 66.9 | 79.3 | 73.2 | 12.4 |
| Nushki | 48.5 | 57.8 | 53.4 | 9.3 |
| Okara | 72.8 | 73.3 | 73.0 | 0.6 |
| Orakzai | 26.4 | 60.8 | 45.0 | 34.4 |
| Pakpattan | 69.5 | 72.2 | 70.9 | 2.6 |
| Panjgur | 35.0 | 37.2 | 36.1 | 2.2 |
| Peshawar | 55.8 | 73.2 | 64.6 | 17.4 |
| Pishin | 30.9 | 46.6 | 39.0 | 15.7 |
| Quetta | 55.4 | 64.3 | 59.9 | 8.9 |
| Rahim Yar Khan | 51.8 | 55.3 | 53.6 | 3.5 |
| Rajanpur | 38.9 | 47.8 | 43.4 | 8.9 |
| Rawalpindi | 83.8 | 82.5 | 83.2 | -1.3 |
| Sahiwal | 70.5 | 75.0 | 72.8 | 4.5 |
| Sajawal | 18.0 | 31.0 | 24.9 | 13.0 |
| Sanghar | 36.1 | 49.7 | 43.0 | 13.6 |
| Sargodha | 80.3 | 79.4 | 79.9 | -0.9 |
| Shaheed Benazirabad | 47.4 | 61.5 | 54.5 | 14.1 |
| Shangla | 34.9 | 58.3 | 47.3 | 23.4 |
| Sheikhupura | 77.0 | 75.2 | 76.1 | -1.8 |
| Sherani | 14.1 | 27.3 | 21.8 | 13.2 |
| Shikarpur | 32.7 | 41.1 | 37.0 | 8.4 |
| Sialkot | 88.6 | 85.4 | 86.9 | -3.2 |
| Sibi | 34.2 | 40.3 | 37.3 | 6.1 |
| Sohbatpur | 38.0 | 51.7 | 45.0 | 13.7 |
| South Waziristan | 27.6 | 39.8 | 33.9 | 12.2 |
| Sukkur | 47.5 | 59.7 | 54.1 | 12.2 |
| Swabi | 67.0 | 80.8 | 74.2 | 13.8 |
| Swat | 57.6 | 75.2 | 66.9 | 17.6 |
| Tando Allah Yar | 35.6 | 45.1 | 40.4 | 9.4 |
| Tando Muhammad Khan | 30.7 | 43.1 | 37.3 | 12.3 |
| Tank | 33.1 | 57.4 | 45.5 | 24.3 |
| Tharparkar | 29.3 | 47.4 | 38.9 | 18.1 |
| Thatta | 21.2 | 26.8 | 24.0 | 5.6 |
| Toba Tek Singh | 79.5 | 78.2 | 78.8 | -1.2 |
| Tor Ghar | 26.5 | 60.4 | 44.2 | 33.9 |
| Umerkot | 34.5 | 53.9 | 45.0 | 19.4 |
| Upper Dir | 53.5 | 73.0 | 63.6 | 19.4 |
| Vehari | 66.2 | 67.9 | 67.1 | 1.6 |
| Washuk | 22.3 | 32.4 | 27.9 | 10.1 |
| Zhob | 38.4 | 50.7 | 45.2 | 12.3 |
| Ziarat | 32.6 | 41.3 | 37.1 | 8.6 |
The geography of enrolment closely tracks the geography of access. Across the 123 districts with both measures, girls’ enrolment is lower where the nearest girls’ middle-or-higher school is farther away (Figure 6). Each doubling of distance goes with about 12 percentage points fewer girls in school; for boys, the corresponding figure is about 9 points.
The analysis cannot distinguish the two slopes reliably enough to say that distance weighs more heavily on girls than boys. Household accounts show a different pattern, where distance is cited more than twice as often when girls leave school. Because the comparison runs across districts, distance is tangled with other forms of deprivation that also depress enrolment.
The next comparison calculates the gaps within each district, then compares them across districts. Boys and girls then share the same terrain, remoteness and much of the same local context, while the distance between their school networks can still differ. Where girls’ schools are farther away than boys’ schools, the enrolment gap is also wider (Figure 7). The relationship remains after accounting for material deprivation, although a rank-based check gives more weight to poverty than distance.
The result remains suggestive. Social norms that keep daughters closer to home may shape both whether girls remain in school and where girls’ schools are built.
Who the school network is built for
The strongest relationship in the analysis appears when districts are ranked by the girls’ share of the middle-or-higher government network. In the lowest quarter, girls’ schools make up an average of 21.2 per cent of the network and the average district enrolment rate for girls is 35.1 per cent. The progression runs through all four quarters: average district enrolment rises to 46.2 per cent, then 56.3 per cent, before reaching 71 per cent in the quarter where girls’ schools account for an average of 55.4 per cent of the network. Over the same progression, the average gap with boys narrows from 12.9 percentage points to 2.1.
The ordering is striking, but school supply and demand are difficult to prise apart here. Districts that devote more of the government network to girls may also be places where families, officials and local politics are more supportive of girls’ education. The association is the strongest in the analysis, but the chart cannot tell whether greater provision raises enrolment, stronger demand produces more provision, or both.
Sindh complicates the ranking. If schools are counted by whether girls are enrolled instead of their designation, the ordering across quarters breaks. Yet within Sindh, the relationship between distance and enrolment remains under either definition.
Across the different measures, the imbalance appears at several scales: in the share of schools designated for girls, in the distance to the nearest school, in whether a village has one at all, and in enrolment itself. No single measure settles why girls are missing from school. Together, they show how closely the geography of the school network is bound up with who reaches the classroom.
Sources. School locations come from provincial education records. Balochistan publishes coordinates through its open-data portal. In Sindh, the analysis uses the Education and Literacy Department’s Institution Checker, with its Distance Checker used where the published RSU map was missing a pin or placed one more than 300 metres away; about a quarter of published pins required that correction. Khyber Pakhtunkhwa locations come from the Education Monitoring Authority’s school locator, with JSiMS coordinates retained for primary schools. Of 150 schools sampled for validation, 140 could be matched between the two sources. Among those matches, the median difference in location was 29 metres; 65 per cent were within 50 metres and about 11 per cent were more than a kilometre apart. Punjab SIS and Gilgit-Baltistan EMIS publish rosters without coordinates, so locations were reconstructed from settlement names; 95 per cent and 94.6 per cent respectively could be placed. The final dataset contains 118,677 of the 125,622 government schools listed by the provincial sources, or 94.5 per cent. Balochistan’s list is dated 30 July 2026; Punjab’s roster is from August 2026 and the Gilgit-Baltistan roster was harvested on 19 August 2026. Sindh’s portal is undated.
Coverage. School locations are unavailable for the seven ex-FATA merged districts, which contain 6,394 schools by the provincial count, and for eight of Azad Kashmir’s ten districts. Islamabad’s layer is partial. Distance can be measured for 132 of 147 districts; 123 have both school-distance and Census-enrolment data.
Distance. Straight-line distance is calculated from every populated cell in the WorldPop 2020 grid to the nearest girls’ and boys’ school teaching middle grades or above. Distances use a Lambert conformal conic projection for Pakistan, with scale error below 0.5 per cent, and district estimates are weighted by population. Walking time uses the 2020 Malaria Atlas Project walking-only friction surface on a one-kilometre grid, with least-cost paths calculated using MCP_Geometric. Gilgit-Baltistan is excluded from the walking-time comparison; estimates for difficult terrain elsewhere should be treated with caution.
School networks are defined by their official gender designation. Sindh is also tested under two alternative definitions: schools where girls are enrolled, and schools recorded as girls’ or mixed. Under both, the distance gap between the girls’ and boys’ networks falls close to zero across Sindh. Of the province’s 3,617 mixed government schools teaching middle grades or above, girls account for about a third of enrolment.
Enrolment. The 2023 Census Table 13(b) gives the number of girls and boys aged 5 to 16 enrolled at any level, divided by the total population of the same age and sex. Districts created after the 2015 boundary file are recombined with their parent districts before enrolment rates are calculated. The comparison covers enrolment at all levels, so it does not directly measure the middle-school transition. The deprivation measure uses PSLM 2019–20 district rates for households without a toilet, flush toilet or piped water, alongside food insecurity; none of the components contains schooling.
Quartile comparisons. Districts are ranked by the girls’ share of the middle-or-higher government school network and divided into four groups. The reported school shares, enrolment rates and enrolment gaps are unweighted means of district-level values within each group, not pooled rates across its children or schools.
What the data cannot see. The school records do not show whether every school is open, staffed or teaching all the grades for which it is listed. Private and non-formal provision is excluded, and school locations remain unavailable for the merged districts. Distance describes the nearest recorded school, not the journey a child actually makes.