Adaad · Volume 1, Issue 2 · Wednesday 16 September 2026 · Inequality and living standardsIssue 2
Independent data journalism on Pakistan. Adaad reads the numbers behind the economy, workforce and society. Every story names its sources, publishes its data and explains its limits.
Volume 1 · Issue 2 · Inequality and living standards
Key numbers in this issue
Tax, poorest tenth6.5%
of spending · richest tenth 11.8%
Over an hour from care16.4mn
people · motorised travel time
Middle-household spending−5.3%
per person in real terms since 2018–19 · rupee spending doubled
Khuzdar and Rawalpindi93.8%
poor at one end of the headcount · Rawalpindi 9.6%
Taxes reach Pakistan's households through everyday purchases as well as earnings. Using the 2024–25 household survey and that year's tax rules, we estimate how selected taxes, cash assistance and electricity support vary with living standards and income source.
Hiba Sameen15 min readHIES 2024–25 · FY25 statutory rates
Notes. The vertical axis shows selected taxes and support as percentages of expenditure. Each tenth contains 10 per cent of the population, ranked by consumption adjusted for household size. Expenditure excludes the notional value of housing provided without cash payment. Support is shown above zero; taxes and electricity payments above the benchmark are below. The black line shows support minus these payments. The electricity benchmark is NEPRA's national average tariff of Rs 35.50 per unit. Public services and pensions are excluded. Source: HIES 2024–25; FY25 tax schedules; NEPRA FY25 tariff schedules and average-revenue benchmark; Adaad calculations.
Everything below the line is tax paid and everything above it is public money received, both as a share of what the household spends. The black line is the balance. Switch the chart to the income ranking and the top of the distribution changes places with the bottom.
Pakistan’s inequalities run through what the state can collect, whom it can identify and the services it can provide. Where public provision falls short, families must find their own way across.
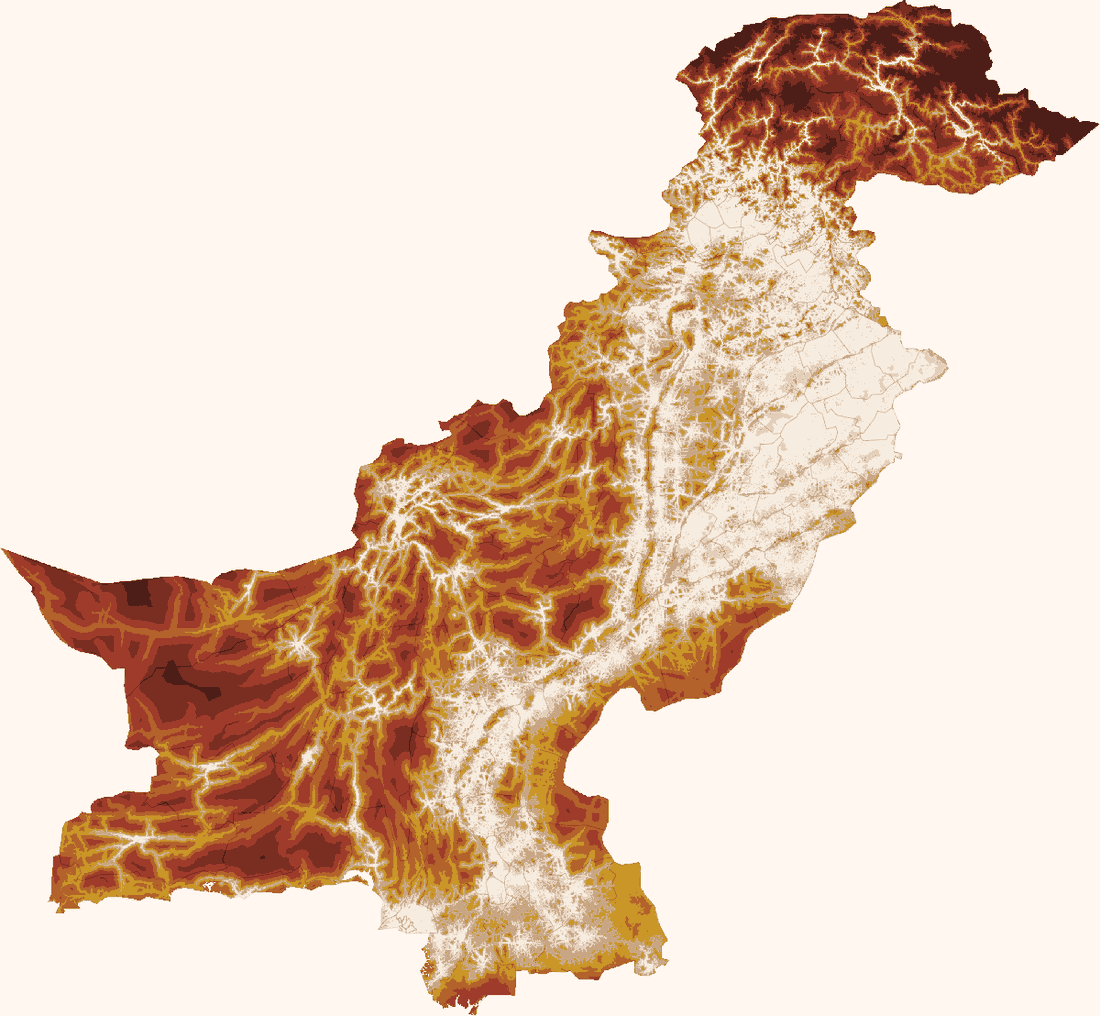
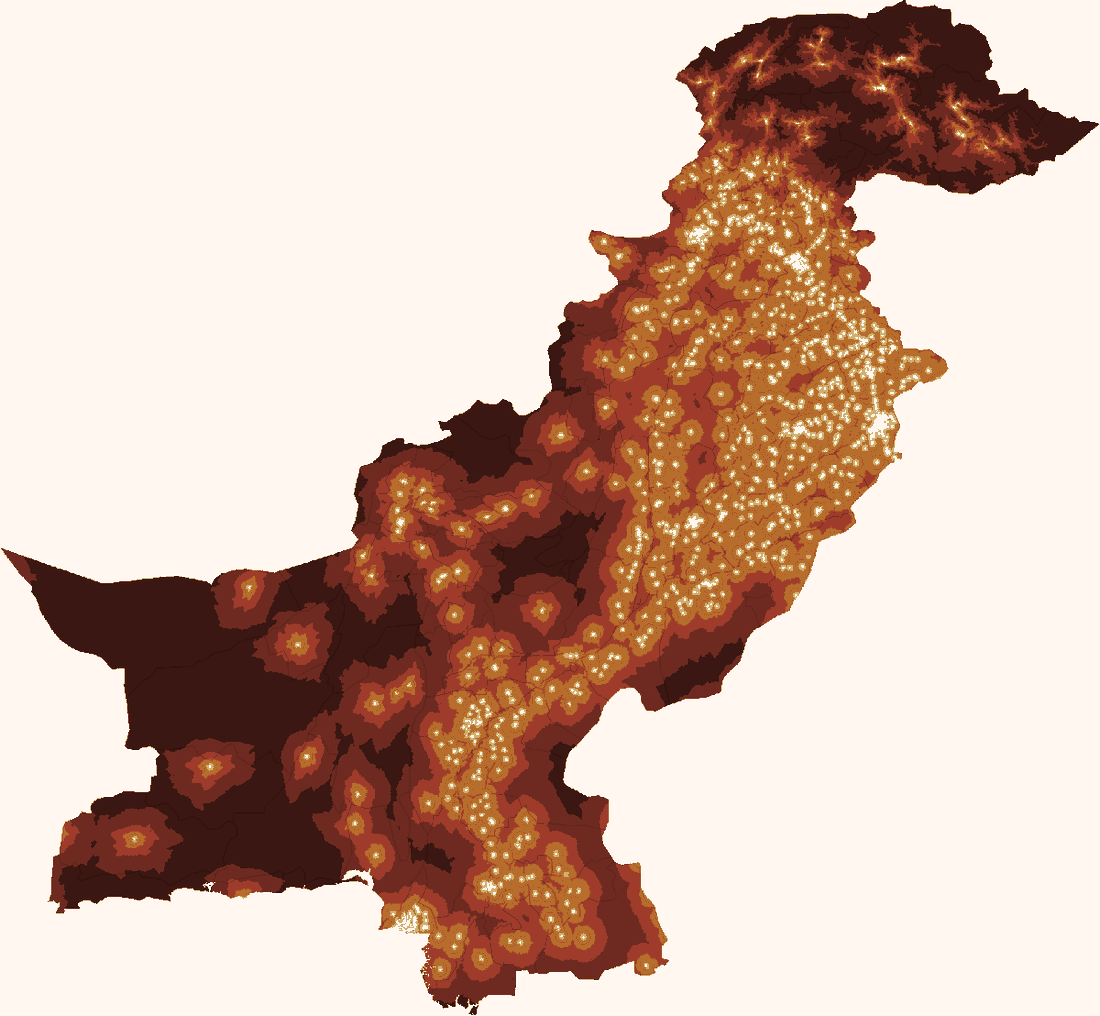
Half the country is eight minutes from a clinic. The fifth of Pakistanis living in the poorest districts are nine times further out, and 16.4 million people are more than an hour from care by any motor vehicle.
Health access · Map · interactive
Care is much harder to reach on foot than by vehicle
1 hour
Source: Malaria Atlas Project, Weiss et al. (2020).
Darker is further from the nearest hospital or clinic. Switch to walking and most of the map darkens: 125 million people are more than an hour from care on foot, against 16.4 million with a vehicle. Drag the threshold to count the people beyond it.
Between 2018–19 and 2024–25, the household in the middle of Pakistan’s consumption distribution doubled what it spent in rupees and bought around 5 per cent less per person. The cut reached almost every line of the budget, food included.
Living standards · Spending · interactive
Food took a larger share of the budget even as real spending on it fell
Source: PBS HIES 2018–19 and 2024–25; PBS CPI; Adaad analysis by Ghufran Khalid.
Each point is a spending category. Left of the vertical line it took a smaller slice of the budget; below the horizontal one the household bought less of it. Food sits low and to the right: a bigger share of the budget, and 12 per cent less of it.
In the quarter of districts that built fewest girls’ schools, 35.1 per cent of girls are in school and the gap to boys is 12.9 percentage points. In the quarter that built most, 71.0 per cent and 2.1 points.
Education · Districts · interactive
Girls’ enrolment is higher where girls’ schools make up more of the government network
Source: provincial school registries and rosters; Census 2023 Table 13(b).
Each dot is a district, coloured by province. Where girls’ schools are a fifth of the government network, a third of girls are in school; where they are half of it, seven in ten. Switch to the enrolment gap to see the shortfall against boys shrink the same way.
Among households with unschooled parents, median consumption is 59 per cent higher where a grown child has a degree than where none attended school. Nevertheless, nearly half of those graduate households still sit below the national median.
Mobility · Plotline · interactive
Graduate households spend 54 per cent more at the median when a parent attended school
Each bar is a group of households whose parents never went to school, sorted by the schooling of their grown child. The capsule is the middle half, the notch the median. The dashed line is where a graduate child’s household sits when the parents did go to school.